
Instrumenting code with dynamic fields using ELK
A story about an effective technique that allowed us to ship dynamic fields for instrumenting our code to ELK allowing our developers to build dashboards to find the root cause.

Hi, In this article I wanted to share how to quickly set up a more dashboard friendly solution to instrument your code using ELK. By Dashboard friendly I mean the ability to have custom fields along with instrumentation data that can be used to build custom dashboards. If you don’t already know what ELK is you should look here. 👈
I’ve written this into two parts: The first part is more like a backstory which led out to use this particular approach and the second part is the actual code snippet on how to implement this.
If you wish, you can skip the first part and directly read the code.
Backstory:
At work, We use ELK stack to monitor our webserver logs and build dashboards to highlight the important metrics such as page views, customer stickiness, and focus more on what’s important to our customers. This is only accessible internally and hosted by ourselves as a single node cluster in our production environment.
Our application stack is based on Ruby on Rails so using Sidekiq for background job processing is a norm. We use multiple instances of sidekiq which process multiple queues based on their priority.
Since these background jobs are critical to us we actively monitor the latencies and queue size. We use Elastalert to create rules and trigger alerts in case of necessary situations. This is what a normal state for our sidekiq looks like, where we can see the Latency and Queue size for each queue represented by a unique color. Now Except for one particular queue, all other queues should have latency < 60 seconds.

Recently we came across an issue where we were seeing huge latencies and queue size was increasing linearly in a particular queue. This is how the dashboard looked at one particular time.

As I had already mentioned we have an alerting system in place, it was triggered very early stage of this graph. Now, this is quite unusual for us and needs to be solved at high priority since this is also affecting the other queue (Pink one) which it shares the Sidekiq instance with.
After spending some time through the logs, I found that because of a bug in code, a particular type of job was taking ~10x than its usual time and this resulted in jobs being piled up. While we fixed it, we thought of being more proactive about such an issue if it occurs in the future so that we can save time finding the root cause. We decided to raise an alert if any particular job was taking an unusual time to finish. Since we did not have an instrumentation strategy in place but we still had our ELK stack ready to push the logs into Elasticsearch and build dashboard and alerts. This is how it can look on paper.
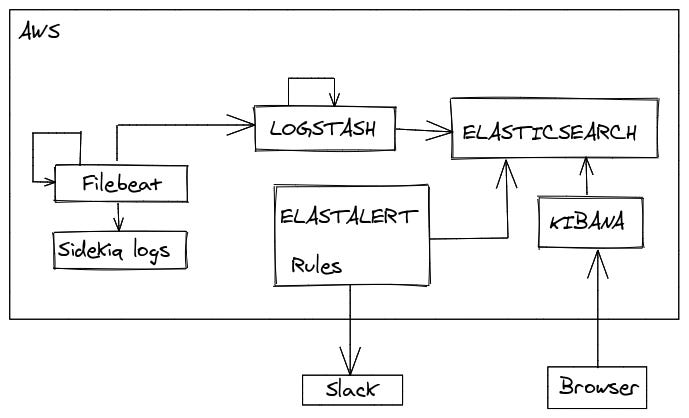
It starts with Filebeat reading Sidekiq logs, optionally processing before shipping them to Logstash where they will be parsed into fields and pushed into Elasticsearch. Then we will build Dashboards using Kibana and write rules to trigger alerts using Elastalert.
Now one easy thing to do would have been to start shipping all Sidekiq logs to logstash, process them, find execution time, and set up the alerts. But there are a few things to consider with this approach. One problem was our background processes can generate huge logs and this would mean we will need to properly plan our Elasticsearch capacity to handle this load. To avoid this problem we can simply filter logs at the Filebeat level to only allow the Sidekiq job execution logs to be parsed to Logstash. But this means we will be able to instrument the Sidekiq overall job execution time but for every other custom instrumentation such as method level execution times we will need to log them and we will need to write a regex to parse those fields in Logstash separately.
Now I wanted to build this instrumentation system flexible enough so that our developers can easily instrument their code without needing to do all of this work. They should be able to send arbitrary instrumentation data to the system and be able to build their own dashboards. Since Elasticsearch is a Document datastore it is capable of storing fields dynamically and index them. I needed to figure out how do we send this data via the log string. After a bit of looking through the ways to achieve this, I found the Logstash JSON filter plugin. This filter plugin allows us to parse JSON String into JSON fields. This is what we want!
So now any developer can log arbitrary data as a JSON string and then Logstash automatically parses it back into the fields and pushes into the Elasticsearch. So we can still reduce the number of logs shipped to Elasticsearch while not having to write customer parsing expressions in Logstash.
Implementation
First, we add a Prefix INSTRUMENTOR to our logs, this can be basically configured with any logger of your framework/choice. In my case, it looked like this.
[INSTRUMENTOR] 2020-05-19T10:16:08.325Z 18265 TID-ottxbpe1 TestWorker JID-d343d2db97b9c INFO: {"elapsed_time":0.7,"type":"SpecialType"}Then we add an include_lines pattern in Filebeat to only match necessary logs

Then we configure Logstash to parse our JSON string into fields.

Once we have this ready, we can see the data in our Elasticsearch. I’ve hidden the actual data but you can see the headers. 😅

Now Elasticsearch supports dynamic mapping and can figure out correct data types for your fields. However, if you want more control you can also use dynamic templates in logstash configuration. Once you have data in Elasticsearch you can quickly set up rules to send alerts for matching conditions and set up custom dashboards for a particular set of jobs.
Now let’s also discuss what are the downsides with this approach:
We need to be careful about the fields which are being converted to JSON string. Marshaling complex-nested types can add overhead. But this can be caught by a code review.
Although Elasticsearch can dynamically figure out data type, fields with the same name from different records should have the same data type otherwise you’ll see conflicts in the index mapping. This can be solved by creating a set of guidelines and having at least a unique field to differentiate between such conflicting records which can be used to filter records while creating visualizations.
We have been running this into production over a month now and this has helped us a lot into quickly reducing the scope to quickly get to root cause of which particular Job or piece of code is causing problems.
If this helps you or you have any suggestions or feedback you’re most welcome. Feel free to reach out in the comments or @sitaramshelke